IOO vs NDQ: Which Has The Best 100 Performing Shares?
Last Updated on 12 March 2024 by Ryan Oldnall
The global and US markets have witnessed remarkable performances in the wake of the COVID-19 pandemic, with notable returns over the past year. The S&P 500 boasts a 1-year total return of 28.88%, while the NASDAQ 100 Index surged by 55.13%, and the S&P Global 100 recorded an impressive 31.95% return [1][2][3].
In this article, we will compare the performance of prominent ETFs: the iShares Global 100 ETF (IOO) and the Betashares Nasdaq 100 ETF (NDQ). Specifically, we will look into their individual performance metrics, holdings, and the countries in which they invest.
To conduct our analysis, we will utilize data from Yahoo Finance and Morningstar [4][5].
IOO ETF Review
Pros
Cons
iShares, a division of BlackRock, stands as a provider of investment options, offering over 1,400 ETFs globally. Catering to a vast investor base exceeding 100 million individuals worldwide, iShares grants access to a wide array of investment opportunities spanning diverse asset classes and regions [6].
As of January 2024, Bloomberg reports BlackRock’s management of assets totalling approximately $10 trillion, a staggering increase of nearly a trillion dollars since March 2023 [7].
The iShares Global 100 ETF presents investors with exposure to a comprehensive selection of large international companies across both developed and emerging markets. By offering access to 100 of the largest global stocks within a single fund, it facilitates international diversification and long term growth opportunities.
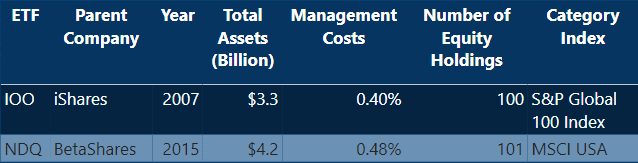
Introduced in Australia on October 10, 2007, the IOO ETF boasts a 16-year history. Managing assets worth $3.3 billion within the ETF, it provides investors with a diversified portfolio of leading global companies [6].
Investors opting for IOO can achieve diversification across various countries and industries, thereby reducing risks associated with holding individual stocks.
NDQ ETF Review
Pros
Cons
BetaShares, the parent company of NDQ, operates on a smaller scale compared to iShares’ parent company, BlackRock. Established in 2009, BetaShares manages approximately 1 million investments and has $35 billion in assets under management, offering 95 ETFs in the Australian ETF market [8].
The Nasdaq 100 ETF, NDQ, stands as a preferred investment choice for those aiming to capitalize on the growth potential of the NASDAQ 100 Index. NDQ seeks to replicate the performance of the Nasdaq 100 Index, providing investors with direct exposure to the market movements of leading technology companies.
Comprising 100 of the most influential non-financial companies listed on the Nasdaq market, the Nasdaq 100 includes tech giants such as Amazon, Microsoft, Apple, and Google (Alphabet).
Launched on May 26, 2015, NDQ has consistently delivered robust performance on the ASX since its inception.
In my assessment of the top-performing ETFs in Australia over the past 5 years, NDQ emerged as the standout performer, underscoring its resilience and potential for longer-term growth.
Management Expense Ratio (MER – ETF Management Fees)
When evaluating the ETF management fees of both IOO and NDQ, they fall on the higher end of the ETF fees. Currently, IOO’s management expense ratio stands at 0.40%, meaning that for every $10,000 invested in IOO, investors would incur $40 in fees.
Similarly, NDQ carries a slightly higher cost at 0.48%, translating to $48 in fees for every $10,000 invested in NDQ. In a previous article, I’ve discussed the ETFs with the lowest management fees available in Australia.
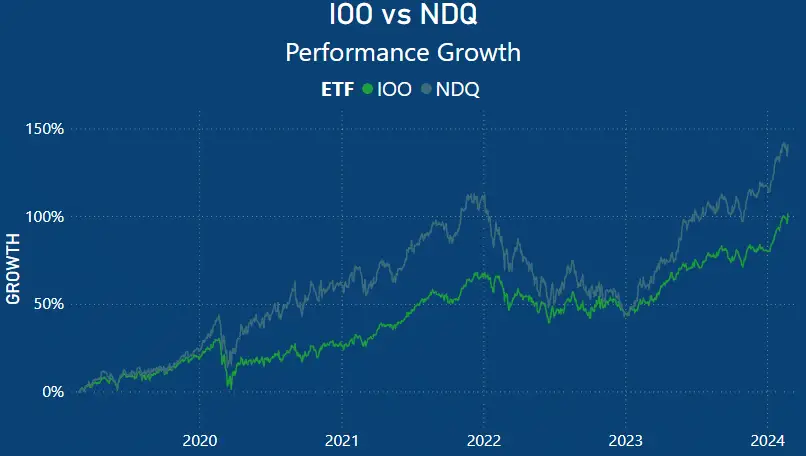
IOO vs NDQ – Performance Chart
IOO vs NDQ – Annualised Returns
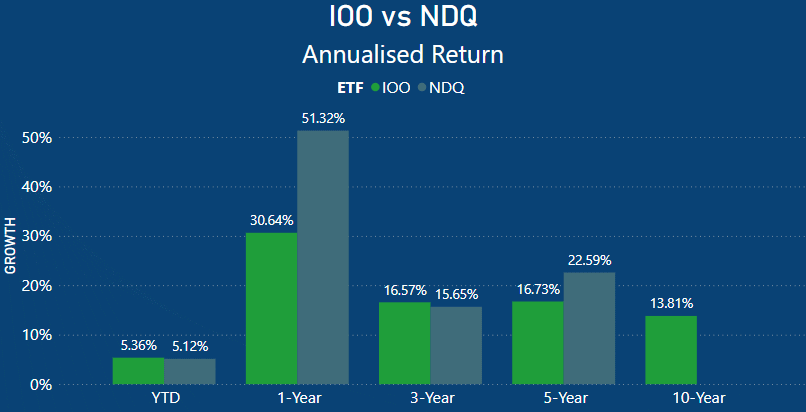
The performance returns of both IOO and NDQ show similarities across the board, except for the one-year return and five- year return.
Year-to-date (YTD) performance of both IOO and NDQ is comparable, with IOO slightly outperforming NDQ. IOO returned 5.36%, a 0.24% improvement over NDQ’s 5.12%.
NDQ’s exceptional performance over the past 12 months significantly surpasses that of IOO, with a remarkable 1-year return of 51.32%. In contrast, IOO returned 30.64%, trailing NDQ by a notable 20.68%.
Moving to the 3-year annualized returns, IOO edges out NDQ with a 16.57% return, while NDQ performed slightly lower at 15.65%.
Over the 5-year annualized returns period, IOO achieved a respectable return of 16.73%, while NDQ boasted an impressive 22.59%. This means that NDQ consistently returned 22.59% annually on average over the 5-year duration.
For context, an annualized total return provides insight into the average return per year over a given time period, allowing investors to understand the compounded growth potential of an investment.
Lastly, with this in mind, IOO has a track record spanning over 10 years, with a current 10-year total return of 13.81%. This means that over the last decade, IOO has delivered an average return of 13.81% annually.
IOO Top 10 Holdings
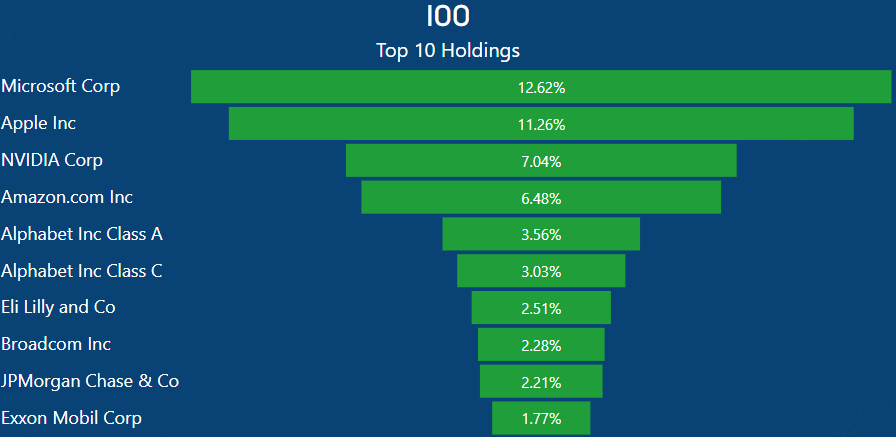
Looking at the top 10 holdings of IOO, many investors would recognize the majority of the names listed, with all being based out of the US.
IOO, like many current top-performing ETFs with US exposure, heavily concentrates on tech companies in their top 10, and IOO is no exception.
IOO currently has 12.62% allocated to Microsoft, 11.26% to Apple, 7.04% to Nvidia, and 6.48% to Amazon.
What this means in real terms for you as an investor is that by owning $1000 of IOO, you would effectively have $122.60 in Microsoft, $112.60 in Apple, $70.40 in Nvidia, and $64.80 in Amazon shares.
NDQ Top 10 Holdings
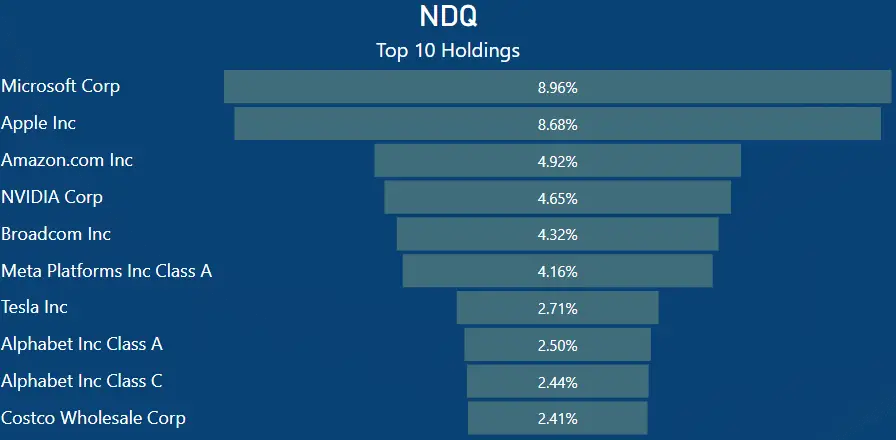
When comparing the top 10 holdings of NDQ against those of IOO, some investors might find it surprisingly similar, considering that NDQ is concentrated in the US NASDAQ 100 while IOO invests globally.
The top 10 holdings of NDQ mirror those of IOO, with the exception of the inclusion of Meta, Tesla, and Costco, at the expense of Eli Lilly and Co, Exxon Mobil, and JP Morgan Chase in IOO.
As expected, NDQ is also heavily weighted in tech companies like IOO and to a greater extent. NDQ has 8.89% in Microsoft, 8.68% in Apple, 4.92% in Amazon, and 4.65% in Nvidia.
In real-world terms, a $1000 investment in NDQ would net you $89.60 of Microsoft stocks, $86.80 in Apple, $49.20 in Amazon, and $46.50 in Nvidia.
IOO vs NDQ – Top Top 10 Holdings As A Total Percentage Of ETF
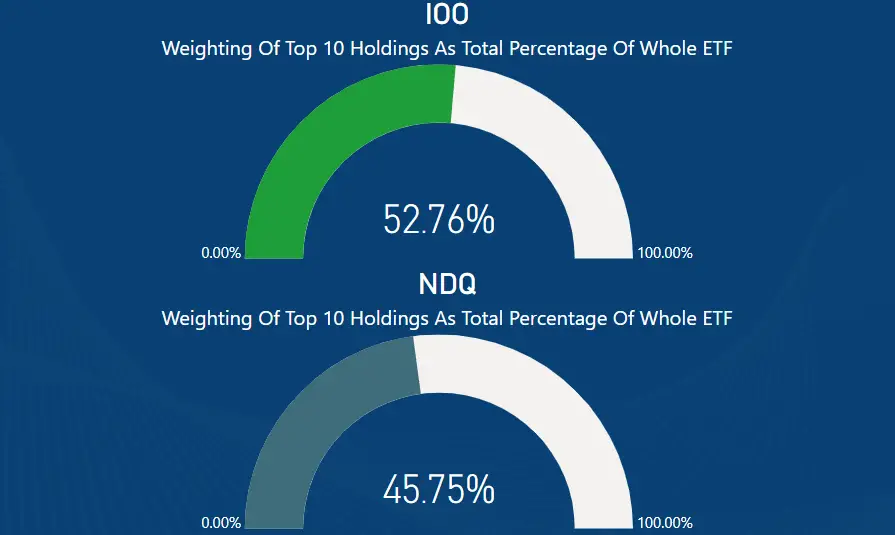
When analyzing the total concentration of the top 10 holdings as a percentage of the overall ETF, the results reveal some expected patterns. In IOO, the top 10 holdings comprise over half of the total ETF, accounting for 52.76%.
Conversely, in NDQ, the top 10 holdings make up slightly less, totaling 45.75% of the total ETF. Despite both IOO and NDQ investing in just 100 companies each within their selected index, this level of concentration is somewhat anticipated.
However, it underscores the significant influence of a select number of American companies on the performance of these ETFs.
IOO vs NDQ – Countries Invested In
The Nasdaq 100 index is a diverse collection of companies from both the United States and internationally. Both NDQ and IOO invest in various sectors such as technology, healthcare, industrial, telecommunications, basic materials, etc.
The NDQ ETF predominantly holds companies from the following countries:
- United States: 97.09% (largest allocation)
- Netherlands: 1.03%
- Brazil: 0.68%
- China: 0.65%
- United Kingdom: 0.55%
IOO, in contrast, offers a more global investment approach by targeting the top 100 companies worldwide. Its portfolio consists of a diverse selection of large international companies across both developed and emerging markets.
The largest portion of its holdings is allocated to:
- United States: 77%
- United Kingdom: 5%
- Switzerland: 4%
- France: 4%
- Japan: 3%
- Germany: 3%
Additionally, the following countries make up smaller portions of the IOO holdings:
- Netherlands: 2%
- South Korea: 1%
- China: 1%
- Spain: 1%
- Australia: 1%
NDQ vs IOO Market Cap
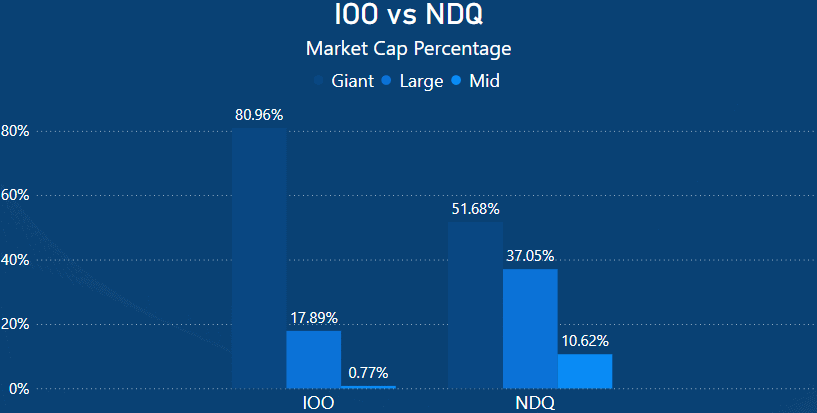
Upon closer examination of the Market Cap percentages, it becomes apparent that IOO is primarily composed of Giant market cap companies, representing over 80.96% of the ETF. This weighting is expected, given IOO‘s primary objective of investing in the world’s largest global organizations.
In contrast, NDQ also places significant emphasis on giant market cap companies, with 51.68% of its portfolio dedicated to these major corporations, alongside 37.05% in large-cap companies. However, IOO maintains a smaller proportion of large and mid-cap companies, accounting for just 17.89% of its composition.
It’s worth noting that IOO allocates 0.77% to mid-cap companies, while NDQ‘s portfolio comprises 37.05% large-cap and 10.62% mid-cap companies.
Summary – IOO or NDQ?
Both the Betashares Nasdaq 100 ETF and iShares Global 100 ETF AUD have demonstrated solid performances over the past 5 years, with NDQ being the stronger performer with a 22.59% annualized return compared to IOO’s 16.73%.
These returns factor in some significant declines in the index, notably in 2022 where NDQ actually lost -24.81% of its value.
NDQ has been driven forward by companies such as Nvidia, Microsoft, Apple, and Amazon, all of which have stakes in artificial intelligence (AI). AI is poised to be the next big thing, with many of the top NDQ holdings in the mix.
When comparing the sector allocations of NDQ and IOO, notable differences emerge. NDQ exhibits a strong tilt towards Information Technology, which makes up the majority of its holdings at 50.4%. Communication Services and Consumer Discretionary follow, with 15.5% and 13.3%, respectively [8][9].
In contrast, IOO’s sector allocation shows less emphasis on Information Technology, comprising 39.08% of its holdings. Instead, Health Care, Consumer Discretionary, and Financials occupy larger portions of IOO’s portfolio, at 11.74%, 11.48%, and 9.61%, respectively [8][9].
Additionally, while NDQ has negligible exposure to Financials and Energy sectors (0.5% and 0.4% respectively), IOO allocates significant proportions to these sectors, with Financials at 9.61% and Energy at 4.72% [8][9].
These variations in sector allocation highlight distinct investment strategies and preferences between the two ETFs, tailored to meet the diverse objectives and risk appetites of investors.
Finally, for individuals interested in diversifying their exposure to the US stock market, I recommend exploring my other articles on IVV vs VGS. Whether you opt for NDQ or IOO, both can offer valuable diversification to your portfolio and cater to specific investment preferences.
This article does not serve as an endorsement or recommendation for products mentioned in the article. The information presented here is based on referenced sources and is accurate as of the date of 24 February 2024. Please note that these articles are written sometime before their publication date.
The information provided in this content is for informational purposes only and should not be considered as financial, investment, or professional advice. We recommend consulting with a qualified expert or conducting your own research before making any financial decisions.
The accuracy, completeness, or reliability of the information cannot be guaranteed, and the provider shall not be held responsible for any actions taken based on the information contained in this content.
- https://www.spglobal.com/spdji/en/indices/equity/sp-500/#overview
- https://www.nasdaq.com/market-activity/total-returns
- https://www.spglobal.com/spdji/en/indices/equity/sp-global-100/#overview
- https://au.finance.yahoo.com/
- https://www.morningstar.com.au/
- https://www.ishares.com/us/about-us#samara-cohen
- https://www.bloomberg.com/news/articles/2024-02-09/nycb-jumps-as-ceo-board-buy-shares-after-4-billion-selloff
- https://www.betashares.com.au/fund/nasdaq-100-etf/
- https://www.ishares.com/us/products/239737/ishares-global-100-etf
Explore our latest articles on ETFs and Shares for more insights into the investment world!
- IVV vs VGS: Which ETF Delivers Better Returns?
- NVIDIA’s Market Value Plummets: $418 Billion Lost Since July Peak Amid 9.76% Weekly Share Price Drop
- Is CrowdStrike Stock a Good Buy Following the Recent Outage?
- VGS vs QUAL: The Best Diversification ETF vs Quality Index
- NDQ vs FANG: Which Tech ETF Is Right For You?