Best India ETF On The ASX
Last Updated on 20 February 2024 by Ryan Oldnall
For those that are wanting to invest in India, there are somewhat limited options, especially if you are looking to do so on a company-specific basis. The trading brokerage fees and the portfolio management alone would be barriers to entry for many.
That’s where ETFs come into play and make the option of investing in Indian companies both doable and practical. On the ASX, two solid options currently exist in the form of Betashares India Quality ETF, IIND, and Global X India Nifty 50 ETF, NDIA.
In this article, we’ll review both IIND and NDIA based on their financial objectives, key holdings, assets under management, management expense ratio, 12-month annual return, and 3-year total annualized return using ASX December 2024 data. With the overall goal of determining the Best India ETF on the ASX.
Why Invest In India?
India stands as the world’s largest democracy and holds the position of the fifth-largest economy globally. According to the IMF, India’s GDP is projected to experience a growth of 6.2 percent in the year 2024 [1].
Looking ahead, India’s robust fundamentals, marked by its youthful demographics, expanding consumer base, consistent urbanization, infrastructure investment needs, and the ongoing digitalization and formalization of its economy which anticipated to be key drivers of sustained growth.
In the year 2022, India ranked as Australia’s sixth-largest two-way goods and services trading partner and secured the fourth position as a goods and services export market. The bilateral goods and services trade between Australia and India amounted to $48.4 billion [2]
Breaking down the figures, Australia’s exports to India reached $34.8 billion, while imports from India totaled $13.5 billion in 2022. As of 2022, Australia’s investment stock in India stood at $17.6 billion, and India’s overall investment in Australia amounted to $34.5 billion [2].
The Morrison Government at the time dedicated $280 million to strengthen collaboration with India, with the aim of advancing our economic ties and supporting job growth and businesses in both countries.
India already plays a crucial role as an economic and security partner in the Indo-Pacific region. In 2020, it ranked as Australia’s seventh-largest trading partner, with two-way trade amounting to $24.3 billion [3].
Furthermore, India stood as the sixth-largest goods and services export market, valued at $16.9 billion. Notably, in 2020, India emerged as Australia’s third-largest market for services exports [3].
As part of the Update to the India Economic Strategy to 2035, the Australian Government is allocated $16.6 million to reinforce connections with India’s key policy and finance institutions and $8.9 million to facilitate increased business engagement and expand Australia’s presence in India [3].
IIND Review
The BetaShares India Quality ETF, IIND, was first introduced to the ASX on August 2, 2019. IIND seeks to replicate the performance of an index, factoring in high-quality Indian companies while excluding fees and expenses.
This index specifically selects 30 top-quality Indian companies based on a combined ranking of essential factors like high profitability, low leverage, and stable earnings.
IIND manages a portfolio comprising the highest-ranked Indian companies based on their quality scores. This quality-focused approach aims to take advantage of inefficiencies in India’s stock market, potentially offering benefits compared to traditional market-cap weighted alternatives over the long term [4]
IIND Assets Under Management (AUM)
As of the most recent information available, the IIND ETF has assets under management totaling $107,275,149 [5].
IIND Holdings
BetaShares India Quality ETF (IIND) currently has 30 equity holdings.
IIND Management Expense Ratio:
The IIND ETF carries a management expense ratio of 0.80%, placing it at the higher end of the spectrum in terms of management fees.
NDIA ETF Review
The Global X India Nifty 50 ETF, NDIA aims to provide investors with a return that mirrors the performance of the NSE Nifty50 Index, prior to fees and expenses. NDIA employs a full-replication strategy, holding all index shares in close proportion to their weights.
NDIA ETF Assets Under Management (AUM)
NDIA has assets under management totaling $83,224,889.
NDIA ETF Holdings
NDIA currently holds a diverse portfolio with 50 holdings.
NDIA Management Expense Ratio:
The NDIA ETF carries a management expense ratio of 0.69%.
IIND vs NDIA ETF
IIND vs NDIA ETF Fee comparison
Comparing the management expense ratios (MER) or management fees of the two Indian ETFs, IIND is the pricier option at 0.80%, while NDIA stands at 0.69%, making it 0.11% more cost-effective than IIND.
To put this into perspective, on a $10,000 investment, IIND would cost you $80 in management fees, whereas NDIA would only cost $69. When analyzing the ASX ETF data for Asia Equity ETFs, which includes both IIND and NDIA, the average management expense ratio for the category was 0.65%.
NDIA slightly exceeds the ASX Asia equity average by 0.04%, while IIND is 0.15% more, highlighting variations in their expense ratios compared to the category average.
IIND vs NDIA ETF 1 Year Performance Comparison
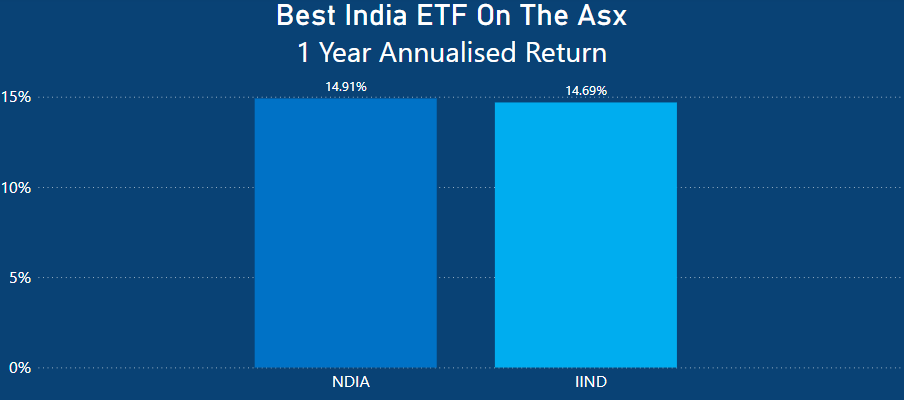
When examining the yearly performance of both NDIA and IIND, it is evident that they exhibited very similar results over the 12-month period. IIND recorded an annual performance of 14.69%, while NDIA marginally outperformed it with a return of 14.91%.
It’s important to emphasize that IIND maintains a portfolio consisting of 30 companies, selected based on various factors mentioned earlier. In contrast, NDIA has a more extensive portfolio with 50 holdings and closely follows the broader NSE NIFTY 50 Index.
IIND vs NDIA ETF 3 Year Performance Comparison
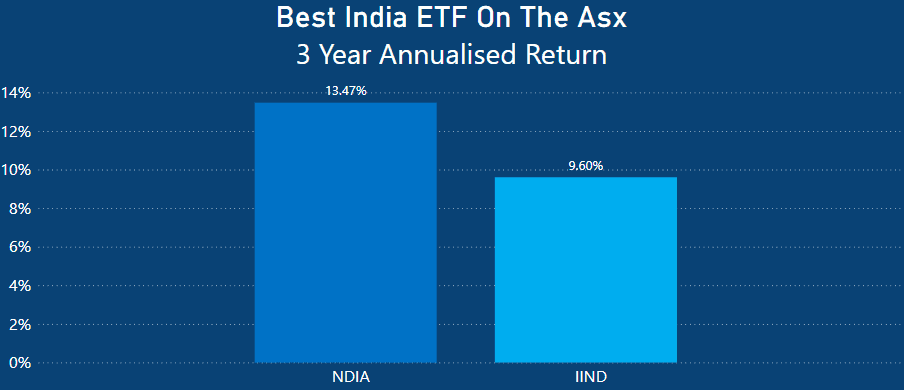
When assessing the 3-year annualized performances, a notable disparity becomes evident between IIND and NDIA, with NDIA emerging as the stronger performer. IIND achieved a total 3-year annualized return of 9.60%.
In contrast, NDIA demonstrated a robust total 3-year annualized performance return of 13.47%. This means that over the 3-year period on an annualized basis, NDIA outperformed IIND by 3.87%.
NDIA vs IIND Recap
BetaShares India Quality ETF, IIND
- 1 Year Performance: 14.69%
- 3 Year Performance: 9.60%
- Management Expense Ratio (MER): 0.80%
- (AUM): $107,275,149
BetaShares India Quality ETF, NDIA
- 1 Year Performance: 14.91%
- 3 Year Performance: 13.47%
- Management Expense Ratio (MER): 0.69%
- (AUM): $83,224,889
Historical performance is not a reliable indicator of future performance. However, NDIA exhibits some advantages over IIND at present, particularly with its lower Management Expense Ratio (MER) which is 0.11% cheaper.
While the one-year annualized performances were comparable, NDIA marginally outperformed IIND by 0.22%. Nevertheless, over a three-year annualized period, NDIA demonstrated a 3.87% stronger performance.
Despite these similarities, key differences contribute to the performance gap, specifically the underlying holdings within the ETF. In certain index ETFs, such as those tracking the ASX 200, minimal variation is observed in the top 10 holdings or overall holdings, a topic I discuss in my A200 vs VAS article.
When it comes to IIND and NDIA they differ significantly in their structures. NDIA assigns a higher weight to its top 10 holdings, contributing to the overall ETF, marked as 57.36% [6], while IIND’s top 10 holdings constitute 49.40% [4].
Notably, two of NDIA’s largest holdings are HDFC Bank Ltd and Reliance Industries Ltd, comprising 13.13% and 9.53%, respectively, totaling 22.66% [6].
In contrast, IIND excludes HDFC Bank Ltd from its holdings and allocates only 3.8% to Reliance Industries Ltd [4].
Summary
Overall, the decision to invest in India is not without its risks, like all investments. India is a growing market, with Real GDP projected to grow at 6.3 percent in FY2023/24 and FY2024/25 [7].
The cost of investing in an ETF makes this a lot more achievable than what it would be on an individual share basis. Moreover, with both ETFs being domiciled in Australia, they are particularly appealing to Australian investors.
IIND has achieved a return of 9.38% since its inception on August 2, 2019 [4], while NDIA has shown a 9.06% performance since its inception on June 19 2019 [6].
When comparing the ETFs side by side, a strong case can be made for NDIA over IIND, primarily because of its lower fees, a greater number of holdings (although it has a higher concentration in the top 10 holdings), and better performance over the past 3 years.
This article does not serve as an endorsement or recommendation for products mentioned in the article. The information presented here is based on referenced sources and is accurate as of the date of January 13, 2024 using ASX December statistical data. Please note that these articles are written sometime before their publication date.
The information provided in this content is for informational purposes only and should not be considered as financial, investment, or professional advice. We recommend consulting with a qualified expert or conducting your own research before making any financial decisions.
The accuracy, completeness, or reliability of the information cannot be guaranteed, and the provider shall not be held responsible for any actions taken based on the information contained in this content.
- https://www.imf.org/en/Countries/IND
- https://www.dfat.gov.au/geo/india/india-country-brief
- https://www.trademinister.gov.au/minister/dan-tehan/media-release/investing-australia-india-relationship
- https://www.betashares.com.au/fund/india-quality-etf/
- https://www.asx.com.au/issuers/investment-products/asx-funds-statistics
- https://www.globalxetfs.com.au/funds/ndia/
- https://www.imf.org/en/News/Articles/2023/12/18/pr23458-india-imf-exec-board-concludes-2023-art-iv-consult