VHY vs VAS: A Battle of Dividends and Growth
Last Updated on 3 March 2024 by Ryan Oldnall
Investors in Australia are spoiled for choice when it comes to domestic ETFs focusing on Aussie companies. Australians have some great options when it comes to growth ETFs and high-yielding dividend or distribution ETFs.
So, in this article, we will explore Vanguard Australian Shares High Yield ETF, VHY vs. VAS, Vanguard Australian Shares Index ETF. These are two very different ETFs, but many of us may struggle to choose between them.
With the S&P/ASX 200 having an annualized total 10-year return of 7.41% [1], many Australian investors look for a quality dividend yield from their Australian stocks.
VAS Review and VHY Review
Vanguard’s Australian Shares Index ETF, VAS, is Australia’s most popular ETF. It closely follows the performance of the S&P/ASX 300, which consists of the 300 largest companies listed on the ASX.
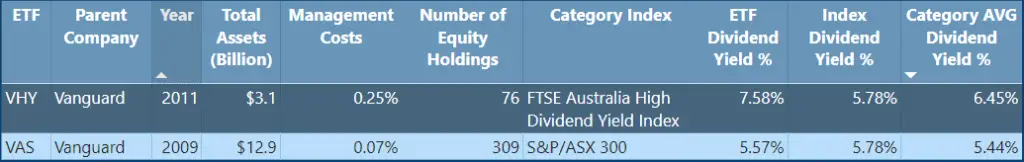
VAS was introduced in 2009 by Vanguard, a well-known global investment management firm with over 50 million investors worldwide. Vanguard has been active in Australia since 1996 and manages more than A$10 trillion in assets globally [2], [3]. VAS itself currently holds $12.9 billion in investments.
In contrast, VHY was launched in 2011 and has assets under management (AUM) totaling $3.1 billion. This high-yield ETF has a smaller equity portfolio with 76 holdings.
Vanguard’s commitment to the Australian market is evident through its recent entry into the super fund sector in October 2022. In light of this development, I’ve done a comprehensive review of the Vanguard Super Review.
ETF Management Fees
ETF management fees encompass the annual charges linked to ETF investment, including tasks related to its oversight and promotion.
These fees typically account for a small percentage of your investment, influencing your overall returns. It’s advisable to opt for ETFs with lower fees as it ensures a larger portion of your earnings stays with you.
ETFs are favored for their cost-efficiency compared to other investment options. Reviewing an ETF’s Product Disclosure Statement (PDS) is essential to understand the fee structure.
VAS stands out with some of the lowest fees in the Australian ETF market, even compared to competitors like BetaShares A200.
VAS recently reduced its management fee from 0.10% to 0.07%, effective from July 3, 2023. This means that for a $10,000 investment in VAS ETFs, you’d pay $7 in fees.
On the other hand, VHY has a 0.25% ETF management fee, which means a $10,000 investment would incur $25 in fees. It’s worth noting that this still represents good value, as many other ETFs have higher costs.
VAS vs VHY – Dividend / Distributions
Most investors have heard about dividends, which are when a company pays shareholders a portion of their profits in a given year. This means that when BHP, CBA, or Telstra turn a profit, they give their shareholders money in the form of a dividend.
In the world of ETFs, this is known as a distribution, but it is essentially the same concept. So, those considering VHY vs VAS are likely doing so due to the distribution factor.
VAS Dividend History
In the case of VAS, the ETF has a dividend yield of 5.57% with an index average of 5.78%. Overall, the category average has been a 5.44% dividend yield. VAS pays out its distribution on a quarterly basis.
VHY Dividend History
The present dividend yield for VHY is currently much higher at 7.58%, with the category average being lower at 6.45%. VHY, like VAS, distributes this on a quarterly basis.
Distribution in Real World Terms
So, what does this all mean in real-world terms? It means that on VHY’s latest dividend distribution date, 30/09/2023, VHY paid out approximately $1.29, with each ETF costing around $66.08 at the time.
On that very same date, VAS paid out a very similar distribution amount of $1.28 per ETF. However, one VAS ETF cost around $87.14. This underpins the ‘yield’ aspect of the ETF.
For $1,000, I could’ve bought 17 VHY ETFs, which would net me $21.93 in dividends. With that same $1,000 of VAS, I would get a dividend distribution of $14.08.
VHY vs VAS – 5 Year Annual Performance Comparison
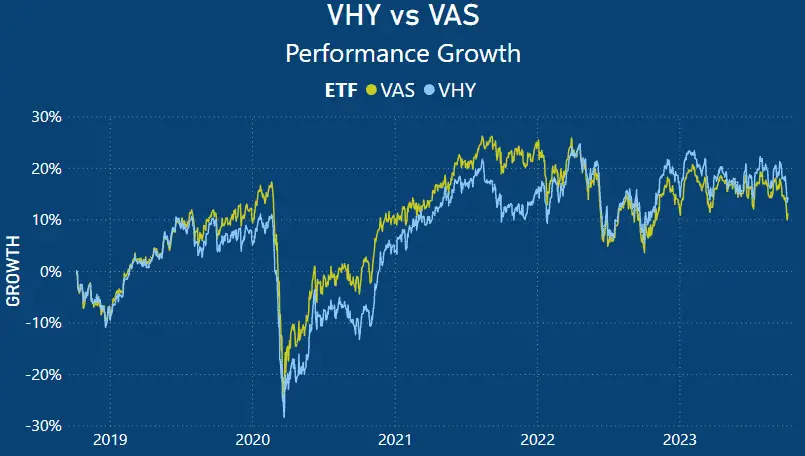
When assessing the performance over the past 5 years, both VAS and VHY have delivered robust results up until recent times. On the tail end of 2018, both VHY and VAS lost ground before experiencing a resurgence in 2019.
In 2020, at the height of the COVID-19 pandemic, both ETFs experienced a decline before rallying in 2021. Throughout this period, up until 2022, VAS has been the visual out-performer.
VHY vs VAS 5 year Annualised Performance
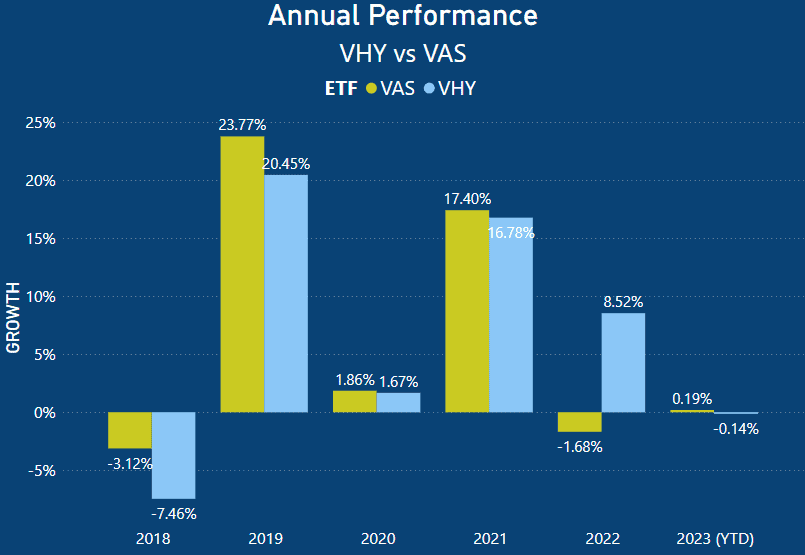
When looking at the annualised performance, it is evident that VAS, being a growth ETF, has had some stronger performances up until 2022.
With the downward trend in the 2018 markets, VAS lost ground to the tune of -3.12%, while VHY had higher losses of -7.46%.
Both rallied hard in 2019, with VAS gaining 23.77%, and likewise, VHY gaining 20.45%. Then, a once-in-a-lifetime event happens, and Covid strikes both the Australian and global economy. VAS and VHY only gained 1.86% and 1.67%, respectively.
All things considered, this isn’t a bad result, you would think considering the whole world was stuck in front of Netflix. Want to know how to buy Netflix shares? You guessed it, I’ve written about that too.
Again, the market rallied into 2021, with VAS posting a 17.40% return, and VHY close behind on 16.78%.
Things get interesting when looking at 2022 onward. With growing concerns around a global recession, the war in Ukraine, and the increasing levels of inflation and mortgage rate hikes in Australia, the overall market was down more than 5% in 2022.
VHY was somewhat shielded from these losses, thanks to its underlying portfolio, which is covered further on. In 2023, the poor growth trend has continued, with both VAS and VHY having much of their 2023 gains wiped out.
Both VAS and VHY have a Year-to-Date (YTD) return of 0.19% and -0.14%, respectively.
ETF Holdings
ETFs consist of a collection of individual stocks, forming the core assets within the ETF. The composition of an ETF primarily depends on the index it aims to replicate, its investment goals, and sometimes specific screening criteria like ESG considerations.
In some cases, certain ETFs may allocate more of their investments to particular stocks. This is true for both VAS and VHY ETFs.
In the case of VAS, despite having over 309 equities, a significant portion of its investments is concentrated in a select few stocks. This is even more pronounced with VHY, which is heavily focused on its top 10 holdings.
Some ETFs employ an equal-weighting strategy, where all the underlying stocks in the ETF are given equal importance. This ensures that if one stock performs better while others perform worse, a process called “rebalancing” takes place to maintain equal weight.
An example of such an Australian ETF is VanEck’s MVW. I delve into this topic in more detail in my review comparing MVW vs VAS – What Is The Best Australian ETF?
VAS Holdings
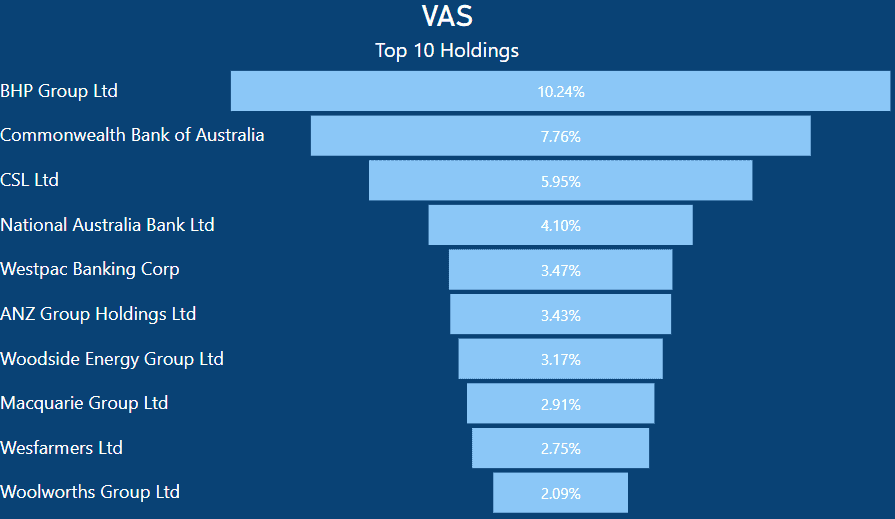
VAS holds significant investments in various Australian companies, with BHP being the top holding. It allocates 10.24% of its portfolio to BHP, which means that for every $1000 invested in VAS, you would own $102.40 worth of BHP stock.
Similarly, Commonwealth Bank of Australia (CBA) makes up 7.76% of VAS’s holdings. Just like with BHP, if you had $1000 invested in VAS, you would own $77.60 worth of CBA shares.
Given the large market capitalization of both mining and banking companies in the ASX, it’s not surprising that VAS has a significant weighting in both.
VHY Holdings
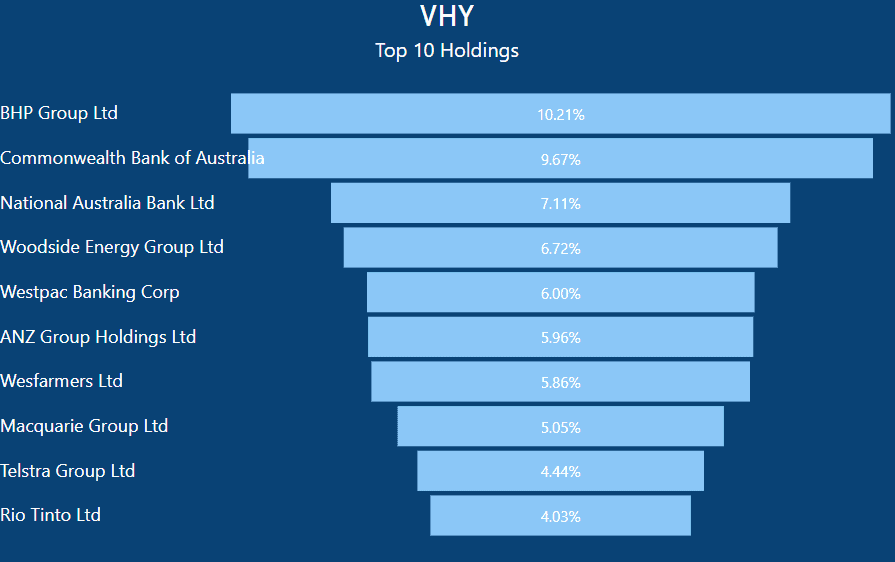
Similar to VAS, VHY also holds a significant position in BHP. If you invest $1,000 in VHY, you would own approximately $102.10 worth of BHP shares.
Similarly, like VAS, VHY also has a substantial investment in CBA. If you had $1,000 invested in VAS, you would have about $96.70 worth of CBA shares.
VHY, though quite similar to VAS, has a strong focus on both banks and mining companies. Since VHY prioritizes high dividend-paying companies, it gives preference to these over growth stocks like Commonwealth Serum Laboratories (CSL).
VHY vs VAS – Top 10 Holdings As Total Percentage of ETF
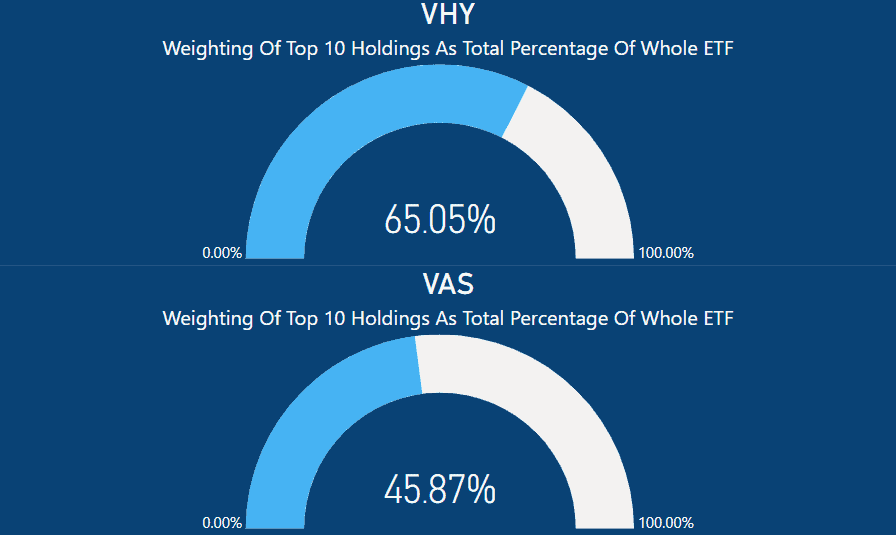
When looking at the top 10 holdings in each ETF, each is heavily weighted by their top 10 stocks.
In the case of VHY, these top 10 shares make up a substantial 65.05% of the entire ETF’s portfolio.
This means that the performance of the ETF is significantly affected by these top 10 companies. For every $1000 invested in VHY, $650.50 would be allocated to these top 10 holdings.
Similarly, in the VAS ETF, the top 10 holdings make up 45.87% of the ETF’s composition. VAS tracks the ASX 300, with a total of 309 equity holdings.
This leaves 54.13% to be distributed across 299 remaining equities. For instance, if each of the remaining stocks had an equal share of this percentage, they would each represent approximately 0.18% of the total.
Just like VHY, if you invested $1000 in VAS, you would have around $458.70 allocated to its top 10 companies.
VAS vs VHY- Market Cap Percentage
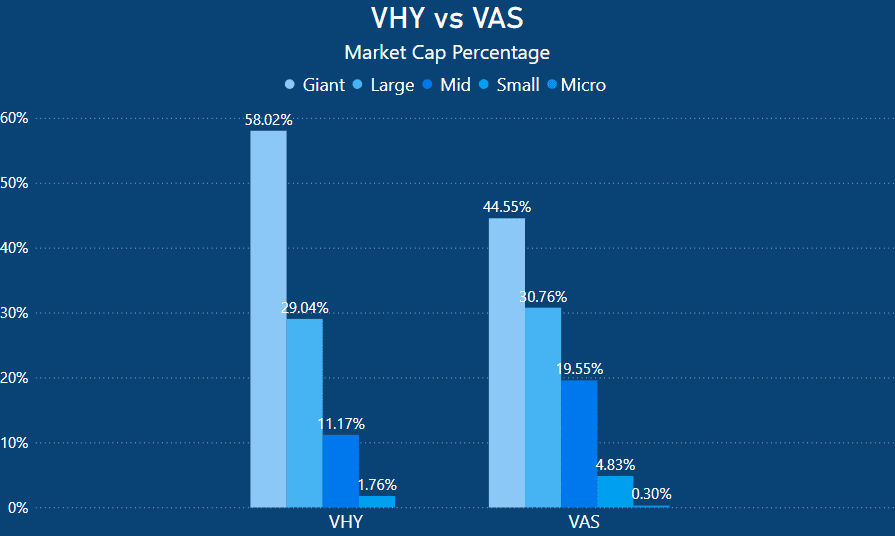
When analyzing the portfolios of both VHY and VAS, it’s evident that they allocate significant portions to large-cap and giant corporations.
Once again, it’s not surprising that a significant majority of both ETFs are invested heavily in banks and miners.
VHY has a 58.02% weighting in giant-cap companies, while VAS comprises 44.55% in giant-cap companies. Similarly, VHY has 29.04% in large-cap companies, with VAS slightly higher at 30.76%. Notably, VHY does not invest in any micro-cap companies.
Summary – Should You Hold VAS or VHY, or Both?
When choosing between VAS and VHY, it’s a personalized decision based on your financial goals. Your choice between VHY and VAS should align with your specific investment objectives.
For example, VHY is ideal for investors looking for income, such as retirees, because of its high dividend yield.
On the other hand, VAS is more suitable for those with a longer investment horizon who want to benefit from long-term market growth while still enjoying a decent dividend yield. Franking credits, which are not covered in this article, also come into play.
I’m not a stock trader, so I’m not going to pick the next Warren Buffet’s Berkshire Hathaway or Tesla. I prefer ETFs, which provide diversification in a straightforward manner. That’s why, for me, ETFs are cost-effective, and you get the best of many worlds.
It would likely be unwise to heavily invest in both VHY and VAS, as they are both concentrated in the mining and banking sectors, just like the ASX market as a whole.
By having significant investments in both, you would expose yourself to the performance fluctuations of these sectors, as well as the specific companies within them, such as BHP, Rio Tinto, CBA, and ANZ.
For me, it makes sense to choose one of these ETFs and consider diversifying with international ETFs.
VHY offers solid growth opportunities with a strong dividend yield, while VAS provides a solid dividend yield and decent growth. Either ETF can form the core of a domestic portfolio, complemented by international ETFs.
I also compare other ETFs in a head-to-head manner, like IVV vs VGS, IOO vs VGS, IOO vs IVV in my analysis.
- https://www.spglobal.com/spdji/en/indices/equity/sp-asx-200/#overview
- https://www.vanguard.com.au/personal/invest-with-us/etf?portId=8205
- https://www.vanguard.com.au/corporate/
This article does not serve as an endorsement or recommendation for products mentioned in the article. The information presented here is based on referenced sources and is accurate as of the date of October 8, 2023. Please note that these articles are written sometime before their publication date.
The information provided in this content is for informational purposes only and should not be considered as financial, investment, or professional advice. We recommend consulting with a qualified expert or conducting your own research before making any financial decisions.
The accuracy, completeness, or reliability of the information cannot be guaranteed, and the provider shall not be held responsible for any actions taken based on the information contained in this content.