IVV vs NDQ: Everything You Need to Know Before Investing
Last Updated on 12 March 2024 by Ryan Oldnall
The US share market captured widespread attention among investors in 2023, driven by global tech stocks such as Apple, Microsoft, Amazon, Nvidia, and others. It was a standout year for many of these industry giants.
In this article, utilsiing Yahoo Finance and Morningstar data we’ll review the performance of both IVV and NDQ, examining the drivers behind their performance and exploring whether holding both IVV and NDQ is a viable strategy [1][2].
IVV Review
The BlackRock iShares S&P 500 ETF, commonly referred to as IVV, stands as a popular option among investors seeking to invest in the U.S. stock market. IVV closely mirrors the performance of the S&P 500 Index, consisting of the 500 largest and most influential American corporations.
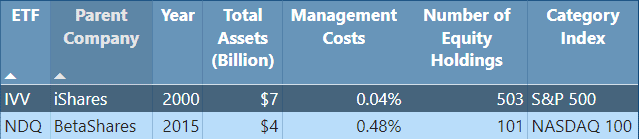
Introduced by the globally renowned investment management firm BlackRock in 2000, IVV has achieved remarkable success since its inception.
As of January 2024, Bloomberg reports that BlackRock manages assets totaling approximately $10 trillion, marking a staggering increase of nearly a trillion dollars since March 2023 [3].
In 2018, IVV was domiciled to Australia, a move that significantly streamlined the investment process for Australian investors by reducing administrative burdens such the as W8-BEN and offering better tax advantages.
Furthermore, in December 2022, IVV underwent a 15:1 stock split, meaning that for every IVV ETF held, investors received 15 ETFs.
While a stock split may not yield immediate profit or loss, its primary advantage lies in providing individual investors with increased liquidity and accessibility to the ETF.
NDQ Review
The Nasdaq 100 ETF, or NDQ, stands out as a preferred investment for those looking to capitalize on the NASDAQ 100 Index’s growth potential. NDQ aims to track the Nasdaq 100 Index’s performance, providing investors with direct exposure to the market movements of leading tech companies.
The Nasdaq 100 comprises 100 of the most influential non-financial companies listed on the Nasdaq market, including tech giants like Amazon, Microsoft, Apple, Google (Alphabet).
NDQ was introduced on May 26, 2015, and has consistently delivered strong performance on the ASX since its inception.
In my review of the top-performing ETFs in Australia over the past 5 years, NDQ emerged as the standout performer, showcasing its resilience and potential for long-term growth.
BetaShares, NDQ’s parent company, operates on a smaller scale compared to iShares’ parent company, BlackRock. Established in 2009, BetaShares manages around 1 million investments and $35 billion in assets under management, with 95 ETFs on the Australian ETF market [4].
ETF Management Fees
When assessing the management fees of the two ETFs, IVV emerges as the clear winner. IVV currently boasts a management expense ratio of 0.04%, making it one of the lowest on the Australian ETF market, matched only by Betashares Australia 200 ETF, A200.
On the other hand, NDQ is significantly more expensive at 0.48%, which is 12 times the cost of IVV. While this falls on the higher end of current ETF management costs, most would consider it a worthwhile expense given the historic returns achieved by the ETF.
IVV vs NDQ – Annualised Returns
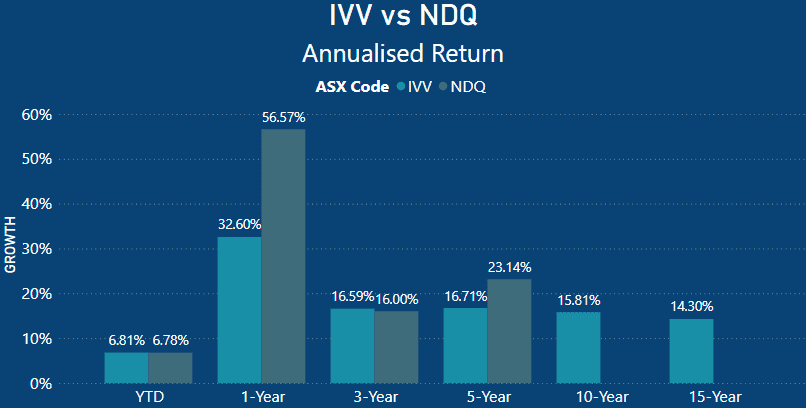
When comparing the average returns of both ETFs, their year-to-date (YTD) performance is neck and neck, with IVV producing a 6.81% return, slightly ahead of NDQ’s 6.78%. The S&P 500 has started 2024 strongly, matching NDQ’s performance, despite its larger market index.
Examining the one-year performance, there’s little contest between the two. NDQ achieved an impressive 56.57% return over the past year, while IVV posted a highly respectable 32.60%.
To provide perspective, when reviewing the Best Performing ETFs in Australia over the last 10 years, IVV stood out with a remarkable annualized return of 14.91%.
Turning to the three-year performance, the playing field somewhat evens out, with IVV edging out NDQ with a 16.59% annualized return compared to NDQ’s 16.00%. NDQ’s slightly lower return follows the NASDAQ’s decline from its highs in 2021 when it lost nearly a third of its value across 2022.
Over a five-year period, NDQ boasts a better performance of 23.14%, showcasing its resilience through the 2022 dip and the subsequent resurgence in 2023. Meanwhile, IVV has also experienced growth, with a respectable 16.71% annualized return over the same period.
Looking to the longer term, NDQ lacks a track record extending to 10 and 15 years. This underscores the advantage of reviewing a long-standing ETF like IVV, established in 2000.
IVV has demonstrated robust performance, with a 10-year annualized return of 15.81% and a 15-year annualized return of 14.30%. According to Morningstar, a $10,000 investment made 10 years ago in IVV would now be worth $42,000[5].
IVV Top 10 Holdings
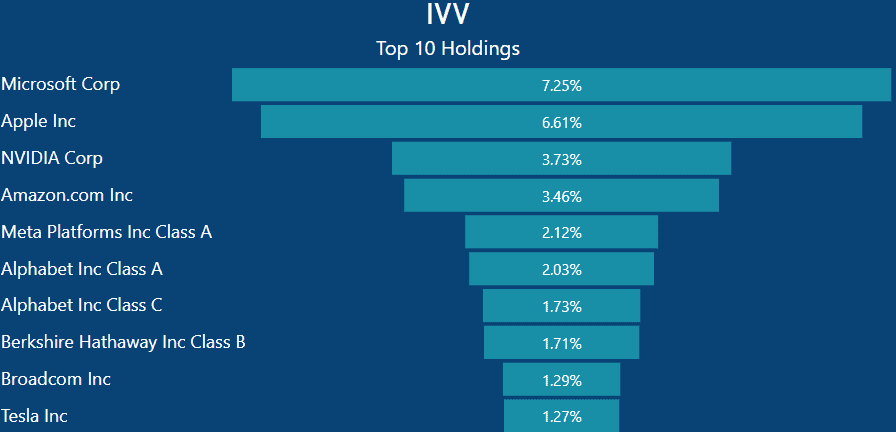
Examining the top 10 holdings of IVV, many names would be instantly recognizable to most, even those who aren’t investors. Microsoft constitutes the largest portion of IVV at 7.25%, followed closely by Apple at 6.61%.
Effectively, this means that if you invested $1000 into IVV, you would have approximately $72.25 worth of Microsoft shares and $66.10 worth of Apple shares.
Other notable holdings in IVV include Google (Alphabet), which accounts for a combined 3.76% across their A and C class shares, as well as Warren Buffett’s Berkshire Hathaway at 1.71%.
NDQ Top 10 Holdings
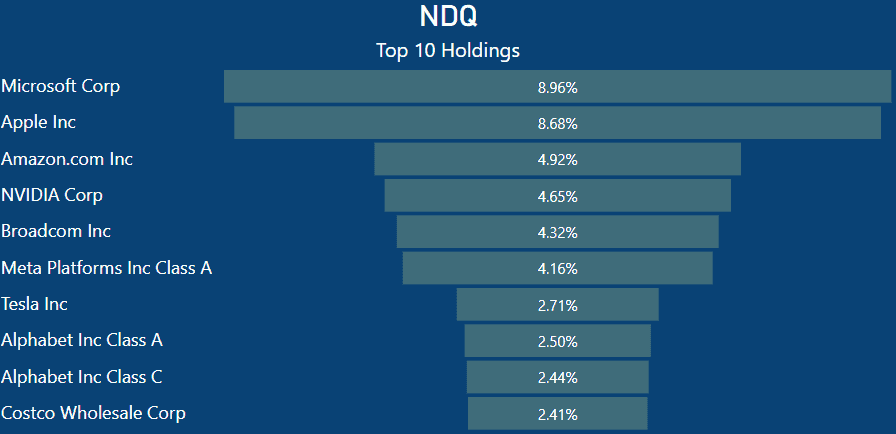
Comparing the holdings of NDQ to those of IVV reveals a strikingly similar picture, albeit with generally higher weightings. Microsoft and Apple, mirroring IVV’s structure, dominate as the top two holdings in NDQ.
For instance, owning $1000 worth of NDQ would translate to approximately $89.60 invested in Microsoft shares and $86.80 in Apple shares. Interestingly, NDQ’s top 10 holdings mirror those of IVV, though with varying weightings.
Notably, NDQ includes the same companies as IVV but replaces Berkshire Hathaway with Costco in its top holdings lineup.
IVV vs NDQ – Top 10 Holdings As Total Percentage of ETF
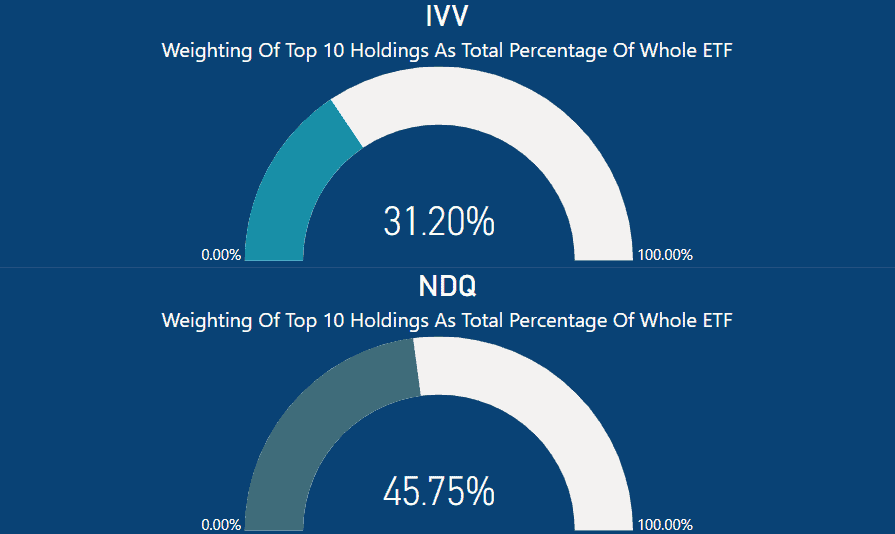
When looking at the top 10 holdings in each ETF, each is heavily weighted by the top 10 stocks. In the case of NDQ, the top 10 shares represent a significant 45.75% of the entire ETF’s portfolio.
IVV on the otherhand is weighted at 31.20% for its 10 top holdings. Whilst 45.75% is a lot of emphasis on just 10 holdings, the index itself is made up of 100 companies. When you compare that to IVV which tracks the S&P 500, IVV has a much higher concentration in it’s top 10 than that of NDQ on a relative basis.
It is worth remembering that both the NASDAQ 100 and S&P 500 are market value weighted. This means that stocks with higher market capitalizations carry more weight and therefore have a greater influence on the index’s value compared to those with lower market caps.
NDQ vs IVV – Market Cap Percentage
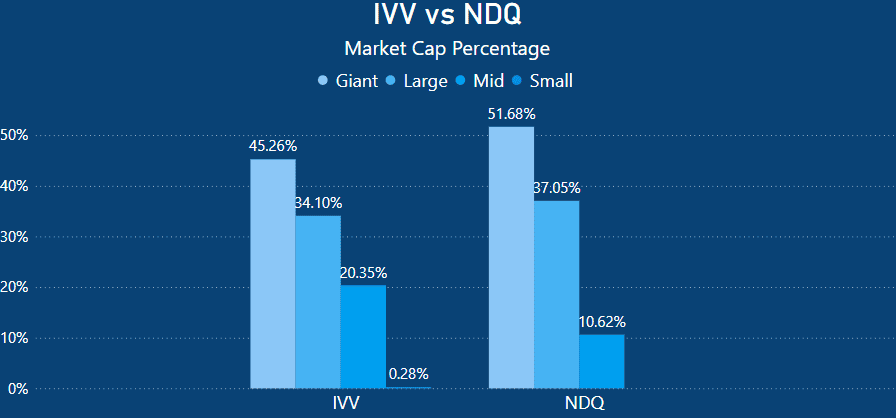
When analyzing the Market Cap percentages, it’s evident that NDQ holds the highest weighting towards Giant market cap companies, with over 50% of the index classified as giant.
NDQ maintains a notable emphasis on large market cap companies, with 37.05% of its portfolio dedicated to this category. IVV, although also significant, allocates a slightly lower percentage, with 34.10% of its holdings falling into this classification.
NDQ allocates 10.62% of its portfolio to mid-cap companies, whereas IVV allocates a higher percentage, standing at 20.35%, suggesting with a greater number of mid sized companies on the S&P500.
Additionally, NDQ excludes small-cap companies entirely, prioritizing larger, established entities. Conversely, IVV includes a minimal allocation of 0.28% to small caps.
Summary – Can You Hold Both IVV and NDQ?
Many investors ask themselves if they can hold both IVV and NDQ in their investment portfolio. As always, the response varies according to your specific circumstances, goals, and objectives.
Considering the latest holdings data for both NDQ and IVV, let’s explore a few scenarios [6,7]. Most investors are concerned about portfolio overlap, which occurs when they hold multiple shares of the same companies in their portfolio.
For example, holding both VAS and A200 may not be optimal, despite VAS investing in the ASX300 and A200 in the ASX200. This is due to the significant weighting of both ETFs in the same top 10 holdings, and considering the ASX’s market-weighted nature, especially given its relatively smaller market size.
Moreover, in my comparison between A200 and VAS, I found minimal difference despite VAS holding 100 more holdings.
In the below presented scenarios, it is assumed that your portfolio consists solely of IVV and NDQ, or at the very least, does not include any other commonly held shares.
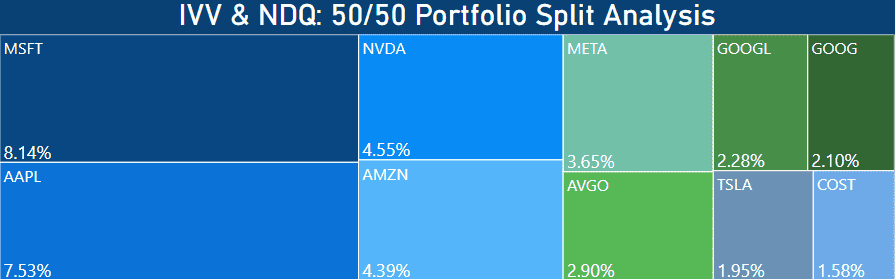
Scenario 1:IVV & NDQ: 50/50 Split
If you hold both IVV and NDQ with a 50/50 allocation, the total overlap within the ETF as a whole is 69.73%. Specifically, the overlap within the top 10 holdings amounts to 39.07%. Here are the percentages of overlap for the top 10 stocks:
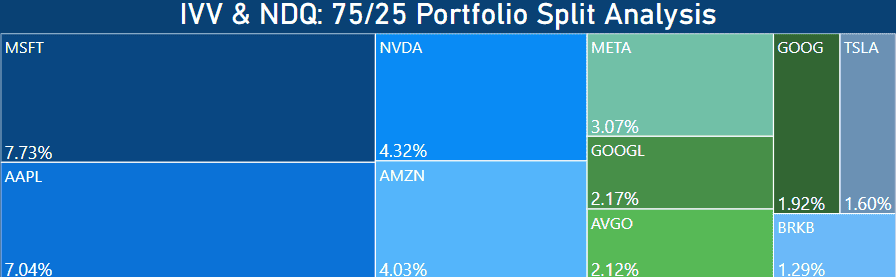
Scenario 2 :IVV & NDQ: 75/25 Split
If you hold both IVV and NDQ with a 75/25 allocation, the total overlap within the ETF as a whole is 57.65%. Specifically, the overlap within the top 10 holdings amounts to 35.27%. Here are the percentages of overlap for the top 10 stocks:
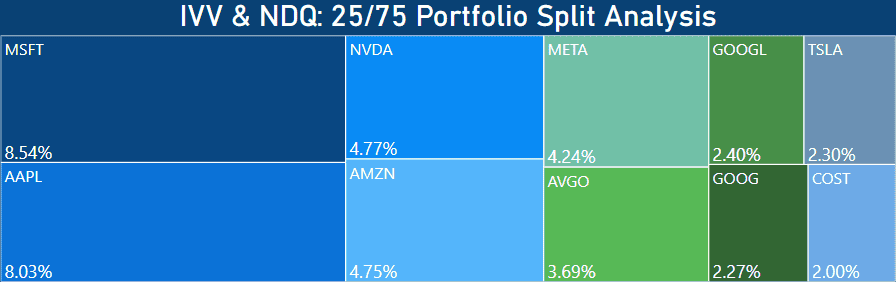
Scenario 3 :IVV & NDQ: 25/75 Split
If you hold both IVV and NDQ with a 25/75 allocation, the total overlap within the ETF as a whole is 81.81%. Specifically, the overlap within the top 10 holdings amounts to 42.99%. Here are the percentages of overlap for the top 10 stocks:
Looking at these weighting figures, the ability to hold both NDQ and IVV comes down to several factors. Firstly, as an investor, are you comfortable with 10 stocks having such a significant influence on the overall performance of your portfolio?
Furthermore, these 10 stocks are predominantly technology-heavy, albeit within sectors expected to experience future growth.
Lastly, given NDQ’s highly concentrated nature with just 100 holdings, a higher allocation to NDQ within your portfolio significantly amplifies the overlap, reaching a staggering 81.81% if NDQ were held at a 3:1 ratio against IVV.
This article does not serve as an endorsement or recommendation for products mentioned in the article. The information presented here is based on referenced sources and is accurate as of the date of February 04, 2024. Please note that these articles are written sometime before their publication date.
The information provided in this content is for informational purposes only and should not be considered as financial, investment, or professional advice. We recommend consulting with a qualified expert or conducting your own research before making any financial decisions.
The accuracy, completeness, or reliability of the information cannot be guaranteed, and the provider shall not be held responsible for any actions taken based on the information contained in this content.
- https://au.finance.yahoo.com/
- https://www.morningstar.com.au/
- https://www.bloomberg.com/news/articles/2024-02-09/nycb-jumps-as-ceo-board-buy-shares-after-4-billion-selloff
- https://www.betashares.com.au/about-us/
- https://www.morningstar.com.au/investments/security/ASX/IVV/performance
- https://www.ishares.com/us/products/239726/ishares-core-sp-500-etf
- https://www.betashares.com.au/fund/nasdaq-100-etf/