
VAS vs VGS: Australia vs The World
Last Updated on 20 February 2024 by Ryan Oldnall
If you’re an ETF investor, chances are you’re familiar with both Vanguard Australian Shares Index ETF (ASX: VAS) and Vanguard MSCI Index International Shares ETF (ASX: VGS). These two Vanguard ETF giants are among the most frequently mentioned Australian ETFs.
Many individuals engage in conversations about these ETFs, often in the context of dividing their share portfolio between VAS vs VGS.
In this article, we’ll directly compare the two, providing insights to assist you in deciding which one to invest in, or whether holding both is the right choice.
While it’s not ideal to compare apples to oranges, let’s go ahead and make this comparison!
Vanguard VGS Review and VAS Review
The Vanguard MSCI Index International Shares ETF, commonly referred to as VGS, remains a preferred choice among investors looking for exposure to global equities.
VGS closely replicates the performance of the MSCI World ex Australia Index, presenting a diversified array of equities from various countries and sectors.
By opting for VGS, which intentionally excludes Australian assets, you minimize the redundancy of owning other ETFs that focus on the domestic market.
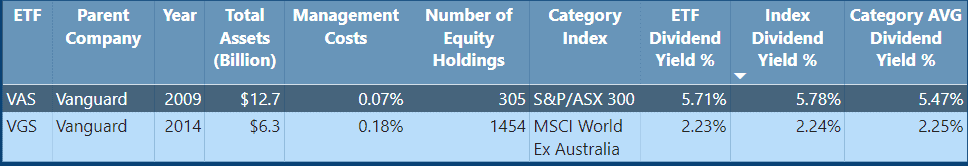
Launched in 2014, Vanguard manages the VGS ETF, and it is recognized as a globally acclaimed investment management firm with a proven track record of serving over 50 million investors worldwide [1].
As of now, VGS has attracted investments totaling approximately $6.3 billion as investors gravitate towards it for ETF diversification.
Similarly, Vanguard’s Australian Shares Index ETF, known as VAS, holds the distinction of being Australia’s most popular ETF. It closely tracks the performance of the S&P/ASX 300, comprising the 300 largest companies listed on the ASX.
Vanguard has maintained a strong presence in the Australian market since 1996 and introduced one of its initial ETFs, VAS, in 2009, amassing an extensive portfolio with assets under management (AUM) exceeding A$10 trillion globally [1], [2].
Investments in VAS significantly surpass those in VGS, with VAS alone amassing $12.7 billion in assets.
Vanguard’s presence in the Australian market is evident, exemplified by its recent introduction of a super fund in October 2022. Following this development, I have conducted a comprehensive Vanguard Super Review.
ETF Management Fees
ETF management fees encompass the annual costs associated with supervising and promoting investments in ETFs. Typically, these charges constitute a small proportion of your investment, affecting your overall returns.
It is advisable to opt for ETFs with lower fees, as this ensures a larger portion of your earnings remains in your possession.
ETFs are widely recognized for their cost-efficiency when compared to other investment options. To gain a better understanding of the fee structure, it is imperative to review an ETF’s Product Disclosure Statement (PDS).
VAS stands out by offering some of the most competitive fees in the Australian ETF market, even when compared to rivals like BetaShares A200.
VAS recently reduced its management fee from 0.10% to 0.07%, effective from July 3, 2023. This means that, for a $10,000 investment in VAS ETFs, you would incur $7 in fees.
On the other hand, VGS carries an ETF management fee of 0.18%, resulting in $18 in fees for a $10,000 investment.
It is noteworthy that, in my view, this still represents exceptional value, considering the level of diversification within the ETF and the fact that many other ETFs come with higher costs.
VAS Dividend History
If you’re an Australian investor, it’s likely that you’re seeking an ETF that provides you with dividends, and VAS certainly fulfills this requirement.
VAS has a notable dividend history, boasting a yield of 5.71%. This yield compares favorably to the index average of 5.78% and the category average of 5.47%.
One of the advantages of VAS is that it disburses its distributions on a quarterly basis, offering investors a regular income stream. Furthermore, being domiciled in Australia brings the added benefit of reduced paperwork and overall ease of management.
VGS Dividend History
With VGS, it’s unlikely that you’re considering this ETF primarily for its dividend-paying potential. The current dividend yield for VGS is 2.23%, which is just slightly below the index’s 2.24% dividend yield.
Similar to VAS, VGS also distributes its dividends on a quarterly basis and is domiciled in Australia.
Dividend / Distribution in Real World Terms
To put this into practical terms, on VAS’s most recent dividend distribution date, 30/09/2023, each unit of VAS paid out approximately $1.28. At that time, the cost per ETF was approximately $87.14.
On the same date, VGS paid out a lower distribution amount of $0.67 per ETF. However, each unit of VGS was priced at $106.43, emphasizing the difference in yield between the two ETFs.
For an investment of $1,000, you could have purchased 9 VGS ETFs, which would have generated $6.03 in dividends. In contrast, with that same $1,000 invested in VAS, you would receive a dividend distribution of $14.08.
This comparison highlights the variation in dividend income between the two ETFs.
VAS vs VGS – 5 Year Annual Performance Comparison
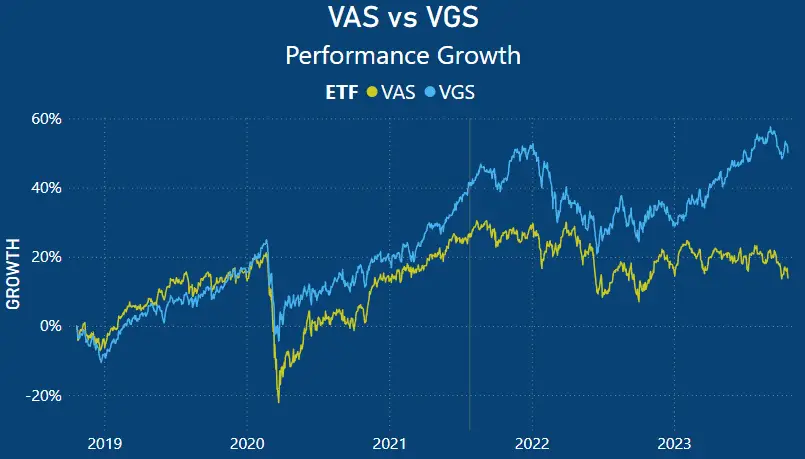
Examining the five-year performance trend starting in late 2018, it becomes evident that VGS has consistently outperformed VAS.
During the COVID-19 pandemic in 2020, VGS did not experience the same levels of decline as VAS and rallied even stronger throughout 2021. This resilience can be attributed to VGS’s diversified presence across various markets and countries.
On the other hand, VAS is concentrated solely in the Australian market and specific sectors, as we will see below.
In 2023, VAS has essentially plateaued, while VGS has reached five-year highs.
VGS vs VAS Average 3 Year, 5 Year and 10 Year Return
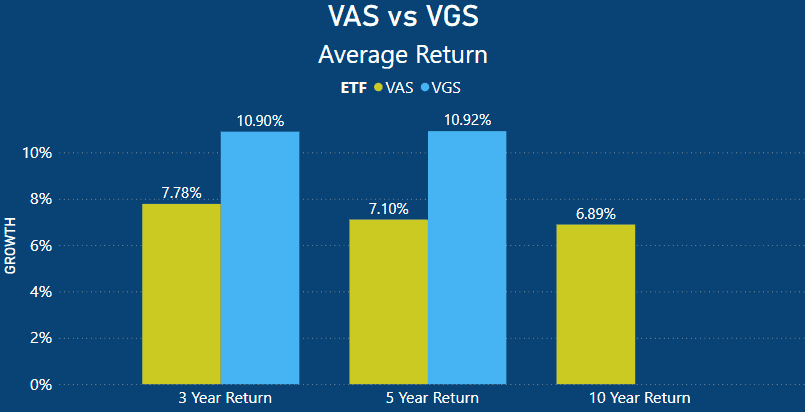
When we analyze the average returns of both VAS and VGS, it becomes apparent that VGS is the superior performer. VAS has a 3-year average of 7.78%, while VGS surpasses it by 3.12% with a 10.90% return.
The 5-year return performances are quite similar, with VGS being particularly impressive at 10.92%, outperforming VAS’ 7.10% return by 3.82%.
VAS has the additional advantage of having been established for over a decade, resulting in a 10-year return of 6.89%. Unfortunately, VGS has not been in existence for a full decade, so its 10-year average is not available.
VAS vs VGS Annual Performances
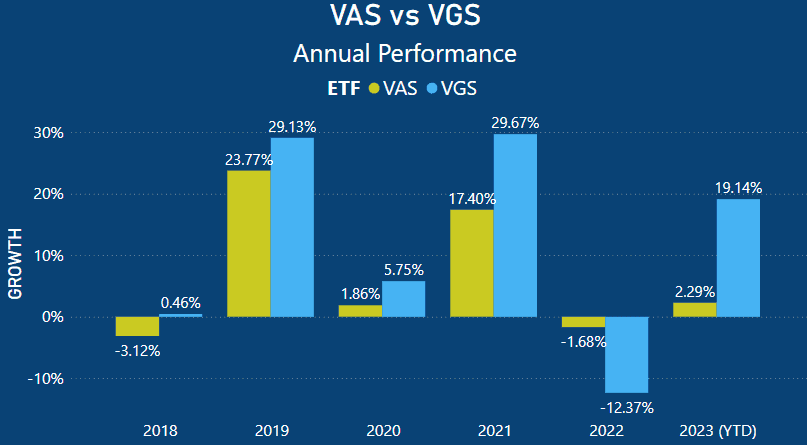
When examining the yearly annual performances of both VGS and VAS, it’s evident that VGS has significantly outperformed VAS every year except for 2022.
In 2018, VAS delivered -3.12%, while VGS made a marginal gain of 0.46%. Both rallied strongly in 2019, with VAS producing a 23.77% return and VGS achieving 29.13%.
In the challenging year of 2020, VAS returned 1.86%, while VGS outperformed with a 5.75% return. In response to a resurgence in the global economy amid the COVID-19 pandemic, VGS delivered a remarkable 29.67% return, while VAS also improved with a 17.40% return.
However, in 2022, market conditions deteriorated due to rising inflation, increased global recession risks, and the conflict in Ukraine. Both VGS and VAS, being exposed to global markets in different ways, endured losses.
Due to its more concentrated exposure to Australian companies, VAS limited its losses to -1.68%, while VGS experienced a larger decline of -12.37%.
In the year-to-date (YTD) for 2023, VGS has displayed robust growth with a 19.14% return, surpassing VAS’s 2.29%. This substantial performance difference of 16.85% is substantial.
Australia continues to grapple with high inflation rates, rising living costs, and persistent high interest rates.
ETF Holdings
ETFs are composed of a collection of individual stocks that serve as the core assets within the ETF. The composition of an ETF primarily depends on the index it aims to replicate, its investment objectives, and sometimes specific screening criteria like ESG considerations.
In certain cases, particular ETFs will allocate larger portions of their investments to specific stocks.
This is applicable to both VAS and VGS ETFs. In the case of VGS, despite having a portfolio of over 1454 equities, a significant part of its investments is focused on a select few stocks.
Conversely, some ETFs employ an equal-weighting strategy, where all the underlying stocks in the ETF are given equal importance.
This approach ensures that if one stock outperforms while others underperform, a process known as “rebalancing” occurs to maintain equal weight.
An example of such an Australian ETF is Vaneck’s MVW. I provide a more in-depth exploration of this topic in my review comparing MVW vs VAS – What Is The Best Australian ETF?
VAS Top 10 Holdings
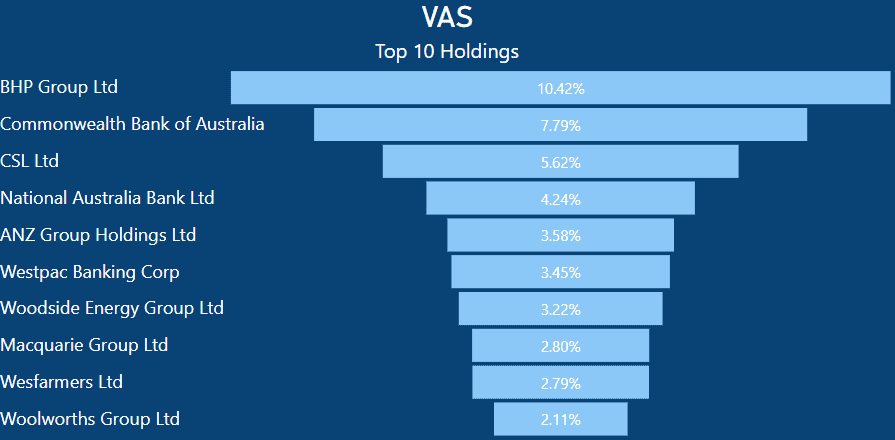
VAS maintains substantial investments in a range of Australian companies, with BHP emerging as its leading holding.
It allocates 10.42% of its portfolio to BHP, implying that for every $1000 invested in VAS, you would possess $104.20 worth of BHP shares.
In a similar fashion, Commonwealth Bank of Australia (CBA) constitutes 7.79% of VAS’s holdings. Just as in the case of BHP, if you had a $1000 investment in VAS, you would hold $79.79 worth of CBA shares.
Given the considerable market capitalization of both mining and banking entities in the ASX, it’s unsurprising that VAS exhibits a substantial weighting in these sectors.
VGS Top 10 Holdings
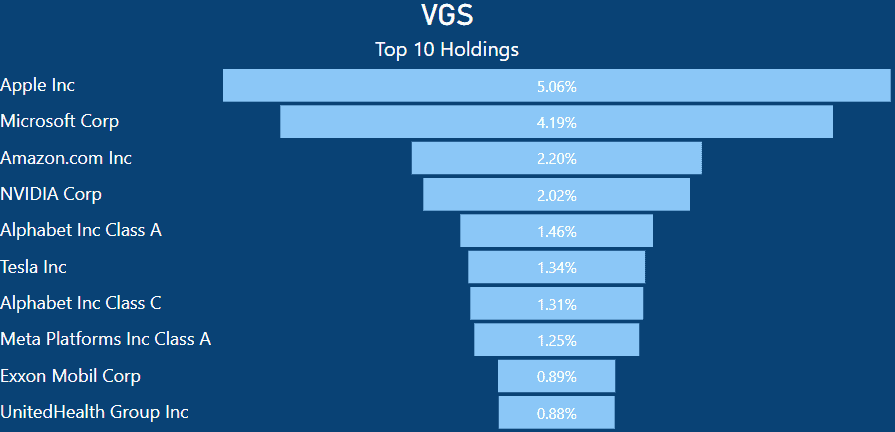
VGS maintains a considerable position in Apple, accounting for 5.42% of its holdings, along with other technology-related companies. With a $1,000 investment in VGS, you would have approximately $50.42 worth of Apple shares.
Similarly, if you hold VGS, you also have a 4.14% stake in Microsoft, equating to $41.40 worth of Microsoft stock.
It’s important to highlight that Apple wields significant influence within this ETF, continuously achieving remarkable milestones, notably being the first publicly traded company to reach a staggering $3 trillion market capitalization.
VGS encompasses numerous technology-related stocks, with 8 of the top 10 having exposure to the technology sector.
As mentioned earlier, U.S. technology companies carry substantial market value, forming a significant portion of the ETF.
IVV vs VGS – Top 10 Holdings As Total Percentage of ETF
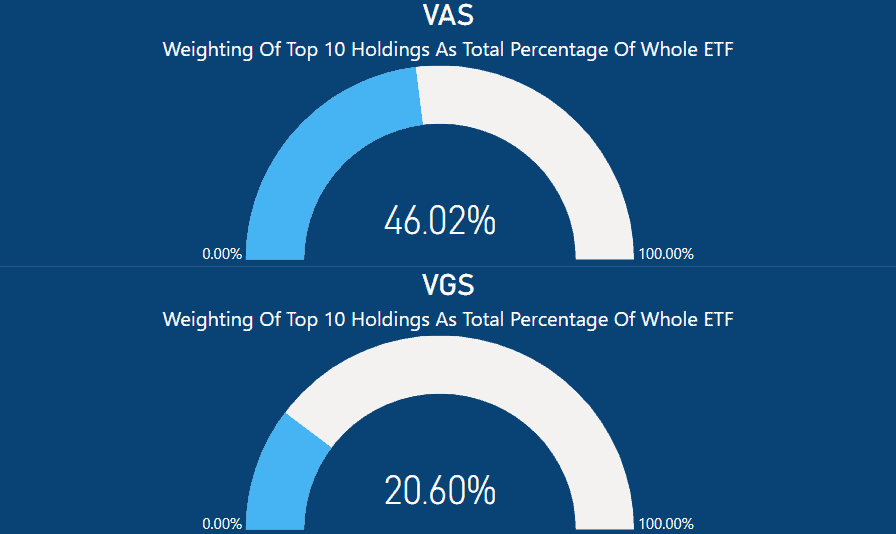
Upon closer examination of the top 10 holdings within each ETF, it becomes apparent that their collective weight within the ETF constitutes a substantial portion.
In the case of VAS, the top 10 shares represent a significant 46.02% of the entire ETF, which is noteworthy considering VAS’s focus on the ASX 300, comprising the top 300 Australian companies.
I have previously conducted comparisons of VAS with other Australian ETFs in my articles, such as A200 vs VAS, VHY vs VAS, and MVW vs VAS.
Conversely, the VGS ETF has its top 10 holdings contributing to 20.60% of the ETF’s composition.
While this is considerably less than VAS, it’s important to consider that VGS invests in nearly five times the number of stocks compared to VAS, with a total of 1,454 stocks.
For example, if you were to distribute the remaining 79.40% of the ETF among the other 1,454 equities, each would theoretically receive an allocation of approximately 0.05%. However, in practice, this allocation varies due to differing weightings for each stock.
VAS vs VGS – Weighting by Continent
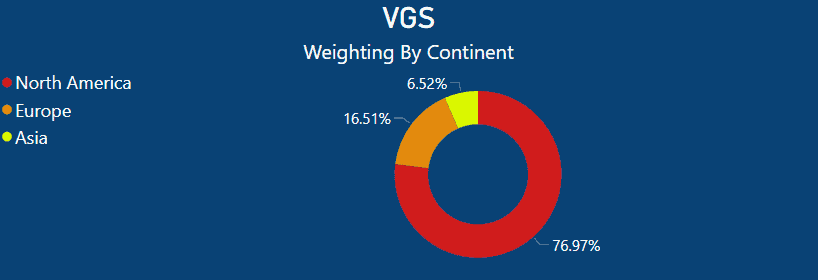
VAS primarily directs its investments toward the ASX, with almost all of its holdings concentrated within Australia.
In contrast, VGS follows a more diversified approach, although it still maintains a significant presence in the US stock market. VGS has an exposure of approximately 76.97% to US stocks, with 16.51% in Europe and 6.52% in Asia.
Summary – Should You Invest in VAS or VGS, or Both?
Deciding on which ETF to invest in is a highly individualized decision based on your personal circumstances. This choice may be linked to your personal goals, objectives, and your current ETF portfolio.
As mentioned at the beginning of this article, we are essentially comparing apples to oranges. VGS has exhibited significantly better performance than VAS and has displayed greater resilience, primarily due to its diversification.
However, it’s important to acknowledge that we all have a natural inclination toward domestic bias and prefer to invest in what we are familiar with.
In my view, holding both VGS and VAS can be a wise strategy. VAS is exposed to the top 300 Australian companies, although these are largely banks and mining companies.
On the other hand, VGS provides substantial exposure to US growth stocks and the global market as a whole. It would likely be more beneficial to allocate a higher percentage to VGS for long-term growth opportunities.
To look at this strategy in action, I recommend going through some of my Super reviews, where I dissect their allocations to provide insight into how your super funds invest for your retirement.
Those articles include my Australian Super Review, REST Super Review, and Australian Super Indexed Diversified Review
Ultimately, most of us invest with an eye on the future, so any additional insight can be quite valuable.
This article does not serve as an endorsement or recommendation for products mentioned in the article. The information presented here is based on referenced sources and is accurate as of the date of October 22, 2023. Please note that these articles are written sometime before their publication date.
The information provided in this content is for informational purposes only and should not be considered as financial, investment, or professional advice. We recommend consulting with a qualified expert or conducting your own research before making any financial decisions.
The accuracy, completeness, or reliability of the information cannot be guaranteed, and the provider shall not be held responsible for any actions taken based on the information contained in this content.